I was away from writing the blogs for a while, but I thought this would be an interesting topic to discuss about issues most organizations face. If you are a new reader to my site and haven’t checked my previous blogs. Do check it on the homepage. Okay, let’s start with the topic
Customer support teams often face a needle-in-a-haystack challenge with unstructured ticket data from ITSM tools like ServiceNow or Jira. Fields like ticket descriptions, resolution comments, and notes—written in natural language—hide recurring issues behind a wall of words.
Sure, structured fields like priority, category, or location can paint pretty charts with a few pivot tricks. But the real gold lies in the narrative—the technician’s or user’s input. That’s where the insights live.
So, how do you separate the wheat from the chaff? How do you summarize the story buried in thousands of records? That’s the rub—and where most organizations drop the ball
In this post, we’ll explore how to put spaCy to work for analyzing raw ticket data. Now, you might ask—why bother, when most Enterprise Service Management platforms already offer analytics?Fair point. But here’s the catch: those analytics often come as bells and whistles—add-ons with a price tag. Sure, you could call in the big guns with AI services. That’s the preferred route.
But if the budget’s tight or you do not have direct system access, yet still want to make sense of the mess, here’s a boots-on-the-ground alternative.
Okay, enough talking, let’s get into action. What do we need – Python, Visual Studio code(Optional but recommended), some knowledge of coding (no issue if you don’t know, you can still tweak and use my scripts), and most importantly—a burning curiosity to uncover what’s really going on in your environment.We’ll also use spaCy, a powerful NLP library, to analyze a sample ticket dump and extract frequent issues
Step 1: Data Preparation-Obtain the ticket data in .xlsx format. Perform a basic quality check by reviewing a few records to identify which fields—such as Description, Resolution Comments, or Summary—offer meaningful insights. Create a copy of the file and remove all irrelevant columns. Optionally, retain the ticket number if you plan to perform further analysis using tools like Power BI.
Some concepts before we go further
- Tokenization
- Definition: Splitting text into smaller units (called tokens) such as words, sentences, or subwords.
- Example:
"I love reading books."→ Tokens:["I", "love", "reading", "books", "."] - Why it’s important: Computers can’t directly understand raw text. Tokenization converts text into manageable chunks that algorithms (like search, NLP models, or chatbots) can process.
- Lemmatization
- Definition:Reducing a word to its base or dictionary form (lemma), while considering the context and grammar.
- Example:”running” → “run”, “better” → “good”,”mice” → “mouse”
- Why it’s important:Ensures that different word forms are treated as the same concept. Helps in search engines, text analysis, and NLP where meaning matters.
Step 2: Installations
- Python-
- Go to Python Downloads.
- Download the latest stable release (e.g., Python 3.12+).
- Run the installer:
- Check “Add Python to PATH” (important!).
- Click Install Now. Verify using -python –version
- Visual Studio code-
- Download from Visual Studio Code.
- Install it with default options.
- Open VS Code.
- Pandas and Numpy-
- pip install pandas
- pip install numpy matplotlib
- Spacy
- python -m spacy download en_core_web_sm
- python -m spacy download en_core_web_md
- python -m spacy download en_core_web_lg
Step 3: The Script
import pandas as pd
import spacy
from collections import Counter
import matplotlib.pyplot as plt

# Load spaCy model
# we installed small(en_core_web_sm), medium(en_core_web_md) and Large (en_core_web_lg)models in previous steps. Small gives #speed while large gives better result. In this example I am using large model
nlp = spacy.load('en_core_web_lg')

# Define exclusions and synonyms -> This is extremely important. if your data set has something user, Issues or some
# keywords which you want to exclude , place it within [] below
exclude_keywords = ['user', 'issue', 'reported', 'due']
# Define Synonym-> This is again important to use synonym. For e.g Password reset, Password, Account locked all are related #to password only. You can have this synonym map to have it one place. Which means python will treal Password reset, #Password corp password all password related issues only
synonym_map = {
    'account password': 'password', 'application password': 'password',
    'corp password': 'password', 'password reset': 'password',
    'login': 'password', 'authentication': 'password',
    'configuration/reinstallation':'reinstallation'
}

# Load and clean data. Save this file in the same directory where sample_ticket_dump is stored.
df = pd.read_excel('sample_ticket_dump.xlsx', engine='openpyxl')
df['Clean_Description'] = df['Description'].fillna('').astype(str).str.lower().str.strip()

# Process text: tokens and noun phrases
def process_text(text):
    doc = nlp(text)
    tokens = [synonym_map.get(token.lemma_.lower(), token.lemma_.lower())
              for token in doc if not token.is_stop and not token.is_punct
              and len(token.lemma_) > 2 and token.lemma_.lower() not in exclude_keywords]
    phrases = [synonym_map.get(chunk.text.lower(), chunk.text.lower())
               for chunk in doc.noun_chunks if not any(token.is_stop for token in chunk)
               and not any(keyword in chunk.text.lower() for keyword in exclude_keywords)]
    return tokens, phrases

# Apply processing
df[['Tokens', 'Noun_Phrases']] = df['Clean_Description'].apply(process_text).apply(pd.Series)

# Count frequencies
all_tokens = [token for tokens in df['Tokens'] for token in tokens]
all_phrases = [phrase for phrases in df['Noun_Phrases'] for phrase in phrases]
top_tokens = Counter(all_tokens).most_common(10)
top_phrases = Counter(all_phrases).most_common(10)

print("Top Tokens:", top_tokens)
print("Top Noun Phrases:", top_phrases)

# Visualize
if top_phrases:
    phrases, counts = zip(*top_phrases)
    plt.figure(figsize=(8, 5))
    plt.barh(phrases, counts, color='#4CAF50')
    plt.xlabel('Frequency')
    plt.ylabel('Issues')
    plt.title('Top Ticket Issues')
    plt.gca().invert_yaxis()
    plt.tight_layout()
    plt.savefig('top_issues.png')
    plt.show()

# Export
pd.DataFrame(top_phrases, columns=['Issue', 'Frequency']).to_csv('issue_summary.csv', index=False)
print("Results saved to 'issue_summary.csv'")
Step 4: Run the script
py <your python filename>.py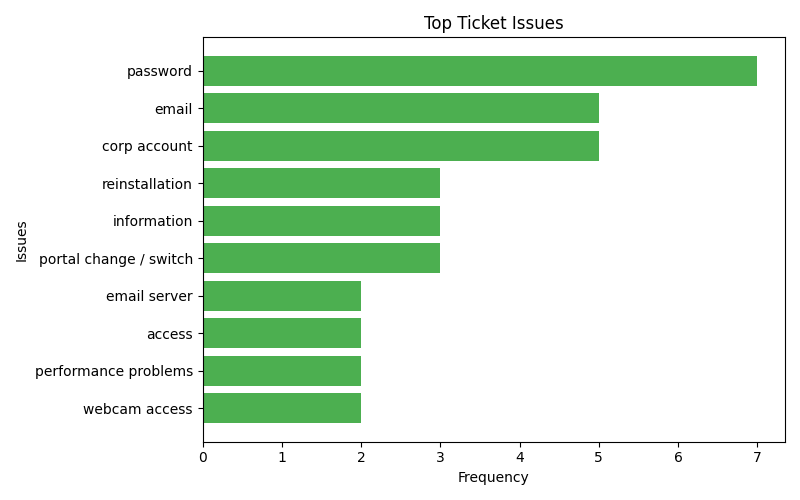
Try running the script with your ticket dump and share your findings! Have questions? Drop them in the comments or do reach me out on Linkedin